All posts by jd

Real estate broker, civil engineer and general contractor.

Sierra Nevada Snowpack Is Virtually Gone; Water Content Now Is Only 5 Percent of Historic Average, Lowest Since 1950

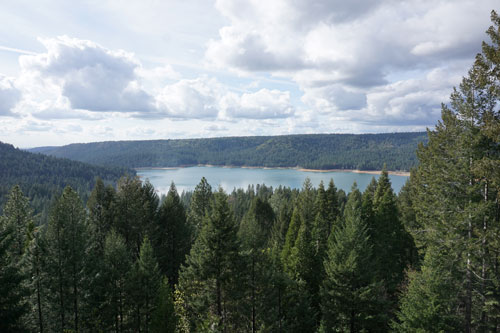
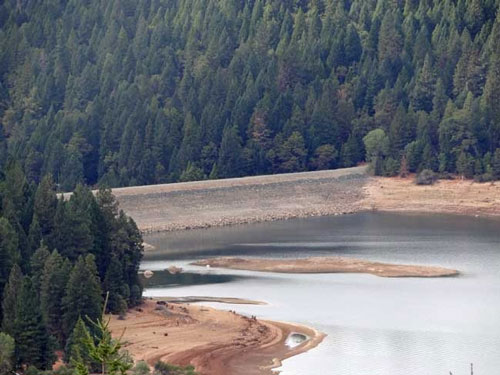
Scott’s Flat Reservoir Sept 25, 2014. Lowest I’ve seen the reservoir since I’ve lived in Cascade Shores. Picture taken by John J. O’Dell off my deck in Cascade Shores.

 April 1, 2015

SACRAMENTO – The California Department of Water Resources (DWR) found no snow whatsoever today during its manual survey for the media at 6,800 feet in the Sierra Nevada. This was the first time in 75 years of early-April measurements at the Phillips snow course that no snow was found there.

Governor Edmund G. Brown Jr. observed the survey, which confirmed electronic readings showing the statewide snowpack with less water content today than any April 1st since 1950.

Attending the survey with Governor Brown was DWR Director Mark Cowin, who said Californians can expect to receive almost no water from the meager snowpack as it melts in the coming weeks.

“Today’s survey underscores the severity of California’s drought,” he said. “Water conservation must become a way of life during the worst drought in most Californians’ lifetimes.”

Today’s readings are historically significant, since the snowpack traditionally is at its peak by early April before it begins to melt. Electronic readings today found that the statewide snowpack holds only 1.4 inches of water content, just 5 percent of the historical average of 28.3 inches for April 1. The previous low for the date was 25 percent in 2014 and 1977.

The Phillips snow course, which has been surveyed since 1941, has averaged 66.5 inches in early-April measurements there. Four years ago today, the measured depth at Phillips was 124.4 inches. The deepest April 1st Phillips measurement was 150.7 inches in 1983, and the lowest previously was 1.04 inches in 1988. Photos of previous surveys at Phillips can be found here.Images from today’s survey will be posted at that link as soon as possible.

Electronic readings indicate the water content of the northern Sierra snowpack today is 1.4 inches, 5 percent of average for the date. The central and southern Sierra readings were 1.5 inches (5 percent of average) and 1.3 inches (5 percent) respectively.

Today’s manual survey was the fourth of the season conducted for the news media at the Phillips snow course just off Highway 50 near Sierra at Tahoe Road 90 miles east of Sacramento. When DWR conducted the first three manual surveys on December 30, January 29 and March 3, the statewide water content in the snowpack was 50 percent, 25 percent and 19 percent respectively of the historical averages for those dates. The decline reflects California’s significantly lower precipitation and the warming trend that made this winter the warmest in the state’s recorded history. What precipitation there was fell mostly as rain due to warmer temperatures.

In what were considered normal precipitation years, the snowpack supplied about 30 percent of California’s water needs as it melts in the spring and summer. The greater the snowpack water content, the greater the likelihood California’s reservoirs will receive ample runoff as the snowpack melts to meet the state’s water demand in the summer and fall.

Continue reading Sierra Nevada Snowpack Is Virtually Gone; Water Content Now Is Only 5 Percent of Historic Average, Lowest Since 1950

NID Adopts Drought Plan; Calls for 20% Conservation

Looking over Scott's Flat Reservoir Picture taken from my deck John J. O'Dell
Looking over Scott’s Flat Reservoir Picture taken from my deck John J. O’Dell

March 25, 2015

Directors of the Nevada Irrigation District on Wednesday (Mar. 25) adopted a series of drought measures that include limits on outdoor watering and a call for continued 20 percent reductions in water use by all district customers.

In a presentation to the NID Board of Directors, Water Operations Manager Chip Close recommended a package of conservation measures designed to meet requirements adopted Mar. 17 by the State Water Board and to ensure that NID has adequate carryover water storage going into next year in case the drought continues into a fifth year.

Urban Water Use

Drought measures in effect for users of piped, treated water include:

  • Outdoor watering no more than three days per week, with no watering during the heat of the day (10 a.m. to 6 p.m.).
  • No watering until 48 hours after a rain.
  • No drinking water service in restaurants unless requested.
  • Hotel and motel guest option of not having towels and linens changed daily.
  • No water use that creates unnecessary runoff.
  • Use of shutoff nozzle on hoses.
  • No washing down of sidewalks
  • Fountains must recycle water

NID and other water purveyors are being required to provide the State Water Board with monthly reports on water use, conservation compliance and enforcement efforts.

Irrigation Water Use

Drought measures in effect for users of canal water include:

  • Voluntary reductions of 20 percent or more with mandatory reductions possible later in the year if conservation goals are not being met.
  • New and increased irrigation water sales are limited to the smallest amount of water necessary for the customer’s beneficial use.
  • All customers are encouraged to use efficient irrigation practices.
  • The irrigation season, which normally runs Apr. 15-Oct. 14, could be shortened this year depending on water availability.

In a water supply update, Water Resources Superintendent Sue Sindt said this year’s water outlook is slightly worse than last year.  She said the mountain snowpack is only about 6 percent of average water content for this time of year and that seasonal runoff is anticipated to be only 20-25 percent of average.

Officials credited district customers with reducing water use by an overall 16.4 percent during the 2014 drought and said an equal level or more will be needed to get through this year.

Close said that continued conservation, tight measurement and controls on the canal system, and the purchase of an available 20,000-25,000 acre-feet of additional water from the Pacific Gas and Electric Company will help meet the district’s water supply needs for this year and next.

For drought information and helpful water efficiency advice, please see NID’s website atwww.nidwater.com.  Water waste may be reported through an online form or by telephone, (530) 271-6799.


Help keep this blog going
Call or write today for all your
real estate needs

John J. O’Dell Realtor® GRI
O’Dell Realty
(530) 263-1091
EMail John O’Dell
BRE#00669941

Error: Contact form not found.

Troubled Waters On The Delta

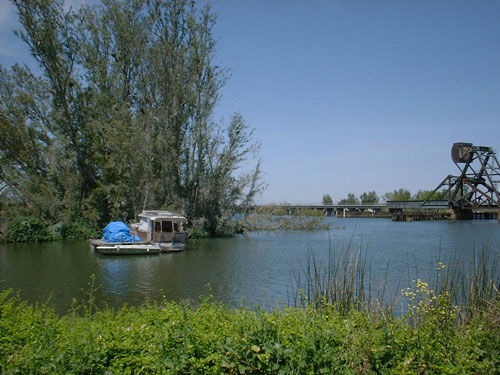
Picture courtesy of the California Department of Water Resources
Delta–Picture courtesy of the California Department of Water Resources

– By Bill Wells
The fabulous California Delta is within an hours drive of the Bay Area, yet you will feel you are in a different world.

The Delta is formed by the confluence of two major California rivers; the Sacramento and the San Joaquin, and covers some 500,000 acres in the central part of the state. It is home to 225 species of birds, 54 fish species, and 52 species of mammals. The Delta produces some $2 billion in annual crop revenue.

You can spend years exploring the 1,000 miles of local waterways by boat. If you travel by car, motorcycle, or bicycle, there are hundreds of miles of back roads, villages, and towns to visit.

You can ride on some of the only remaining ferry boats in California. Bird watching, wine tasting, local museums, antique shops, and art galleries are but a few of the points of interest you will encounter.

The Delta is also noted for it’s excellent fishing and duck hunting. The Rio Vista Bass Festival attracts 15,000 fishermen and friends each year It has been in existence.

Unfortunately, all is not well in this treasure we call “The Heart of California”. The State Water Project and the Central Valley Project divert much of the Delta water to Central and Southern California. The lower water flows in the Delta caused by the diversions have contributed to the decline in fish populations and proliferation of invasive plants that have clogged waterways over the last few decades.

Now with the administration’s plans to divert the Sacramento River around the Delta via twin 40 foot diameter tunnels, it is possible that what is left of the Delta will be destroyed.

Many local grass roots organizations have banded together to fight the project and the Environmental Protection Agency wrote a scathing letter to the National Marine Fisheries Service which has sent the California Natural Resource Agency back to the drawing board to modify the plan to make it less harmful to the estuary.

We are hopeful that the tunnels will never be built and that water flows will be restored to a level that will be beneficial to the native fish and plant life. With a finite water supply and an ever increasing population, California needs to look at ways of creating new water – not reallocating it from one area to another.


Bill Wells is the Executive Director of the California Delta Chambers & Visitor’s Bureau and has been active in the fight to preserve and protect the California Delta. He served for two plus years on the Bay Delta Conservation Plan (BDCP) public meeting panel and is currently a member of the Delta Protection Commission Advisory Committee.

Help keep this blog going
Call or write today for all your
real estate needs

John J. O’Dell Realtor® GRI
O’Dell Realty
(530) 263-1091
EMail John O’Dell
BRE#00669941

Error: Contact form not found.

Nevada Irrigation Districts Lakes and Canals have Unusal Titles

Scotts  Flat Reservoir. Picture taken from my deck. John J. O'Dell
Scotts Flat Reservoir. Picture taken from my deck. John J. O’Dell

How’s the water out there in Wiskey Diggins Canal? Was the Fiddler Green Canal titled after an early day musician? Did you ever wonder how the DSL Canal was named?

The names of water storage and distribution facilities throughout NID are colorful and unusual but, unfortunately, the origination of many of them has been lost through the years.

Many facilities are named for builders, such as Faucherie Reservoir, or for the geographic areas they serve, such as Bald Hill or Pet Hill canals.

Of course, many lakes and canals carry names that are rooted in the area’s rich mining history.

The DS Canal is the lowest elevation of the two NID canals crossed by Red Dog and Banner Lava Cap roads near Nevada City. It was built by NID in 1927-28 to carry water from Lower Scotts Flat into the Nevada City-Grass Valley area.  The DS Canal follows the south side of Deer Creek, hence DS for Deer Creek South. If NID had followed through with an initial plan for a canal on the north side, we would today have the DN Canal.

How Scott Flat was named is unclear, but it is widely understood that it was due to the Scottish miners who lived and worked there in the 1850’s and 1860’s.  Schools once stood near what is now the campground on the north side of the lake.

Rollins Reservoir was named for J.L. Rollins, manager of the Bear River Water and Power Co., the company from which NID acquired the land to build the reservoir.

NID’s first modern water treatment plan, the Elizabeth L. George plant on Banner Mountain, opened in 1969 and was named after the long time community leader who helped gain funding for its construction.

In the high country, Faucherie Reservoir, built prior to 1880, was named after a French engineer who worked for the Eureka Lake & Yuba Canal Co.  “The French must have had a strong influence because French Lake, located upstream of Faucherie and constructed in 1857-59 was originally called Eureka Lake and later changed to French Lake,” wrote NID retiree Terry Mayfield who documented much of the district’ history during his 34 years with the district.

One of NID’s most historic canals is reputed to be the first mining canal in the state.  The Rough & Ready Canal was begun in 1850 as the first effort to build a large-scale mining ditch in California.

According to the Thompson & West History of Nevada County, “a man named Moore commenced to dig one from Deer Creek above Nevada City to Rough and Ready. The magnitude of the undertaking astounded the miners and they thought Moore was a lunatic, but he persevered until he had completed one mile, and then abandoned the enterprise.”

Moore’s project was taken over by a company in 1851 and by 1854 the canal to Rough & Ready was complete. NID took over the canal in 1925 as part of a water system acquired from the old Excelsior Water & Power Co.  Portions of the 13-mile-long Rough and Ready & Ready Canal remain in use today.

Source: Nevada Irrigation District newsletter Volume 35 Number 4 Winter 2014/2015

Help keep this blog going
Call or write today for all your
real estate needs

John J. O’Dell Realtor® GRI
O’Dell Realty
(530) 263-1091

Error: Contact form not found.


BRE#00669941

Home Sales Off to a Bumpy Start in 2015

Photo courtesy of http://www.funnyautos.com/funny-mobile-home.html

Existing-home sales dropped in January to the lowest rate in nine months, according to the National Association of REALTORS®’ latest housing report. All regions across the country saw declines in sales in January, with the Northeast and West posting the largest losses.

Still, the pace of sales was higher than a year ago – at a 4.82 million seasonally adjusted annual rate remains up 3.2 percent compared to a year ago.

“January housing data can be volatile because of seasonal influences, but low housing supply and the ongoing rise in home prices above the pace of inflation appeared to slow sales, despite interest rates remaining near historic lows,” says Lawrence Yun, NAR’s chief economist. “REALTORS® are reporting that low rates are attracting potential buyers, but the lack of new and affordable listings is leading some to delay decisions.”

5 Stats to Gauge the Market

Here’s a closer look at where the housing market stands, based on NAR’s existing-home sales report for January.

1. Inventory: Total housing inventory at the end of January rose 0.5 percent to 1.87 million existing homes available but sale. Unsold inventory is at a 4.7-month supply at the current sales pace.

2. Home prices: The median existing-home price for all housing types was $199,600 – 6.2 percent above year ago levels. “Although sales cooled in January, home prices continued solid year-over-year growth,” Yun notes. “The labor market and economy are markedly improved compared to a year ago, which supports stronger buyer demand. The big test for housing will be the impact on affordability once rates rise.”

3. Distressed sales: Foreclosures and short sales comprised 11 percent of sales in January, down 15 percent from a year ago. Broken out, 8 percent of sales in January were from foreclosures and 3 percent were short sales. The average discount that a foreclosure sold at was 15 percent below market value, while short sales were discounted, on average, 12 percent.

4. Days on the market: Properties tended to stay on the market slightly longer in January – 69 days compared to 66 days in December. Short sales remained on the market the longest at a median of 128 days, while foreclosures tended to sell in 63 days. Overall, 30 percent of homes sold in January were on the market for less than a month.

5. Cash sales: All-cash sales made up 27 percent of transactions in January, down from 33 percent a year ago. Individual investors, who account for the bulk of cash sales, purchased 17 percent of homes in January, below the 20 percent in January 2014.

Regional Breakdown

Here’s a closer look at existing-home sales in January across the country:

  • Northeast: existing-home sales dropped 6 percent to an annual rate of 630,000. Sales are 3.3 percent above a year ago. Median price: $247,800, up 2.7 percent from a year ago
  • Midwest: existing-home sales fell 2.7 percent to an annual level of 1.08 million in January. Sales are still 0.9 percent above January 2014 levels. Median price: $151,300, up 8.2 percent from a year ago
  • South: existing-home sales dropped 4.6 percent to an annual rate of 2.07 million in January, but are still 5.6 percent above year ago levels. Median price: $171,900, up 7.4 percent from a year ago
  • West: existing-home sales fell 7.1 percent to an annual rate of 1.04 million in January, but are still 1 percent above a year ago. Median price: $291,800, up 7.2 percent from a year ago

Source: National Association of REALTORS®

John J. O’Dell Realtor® GRI
O’Dell Realty
(530) 263-1091
EMail John O’Dell
BRE#00669941

Nevada County Fair – August 12 – 16, 2015

Photo courtesy of Nevada County Fair

Five days of fun in Grass Valley

It’s Fair season, and the Nevada County Fair, happening August 12 – 16, has five days of “Simply Fun” planned for Fair-goers of all ages. Held under the shade of the tall pine trees in Grass Valley, the Nevada County Fair is the perfect opportunity to listen to musical entertainment, eat delicious food, enjoy carnival rides and games, visit barns full of animals, and see thousands of community exhibits – all in a community-friendly environment.

While visiting the Fair, zip line across The Green, check out the sky diver flying into the arena during the rodeo, try your hand at gold panning, walk in a water balloon, see baby chicks hatch in the embryology display, watch the Fair’s Family Feud competition, or listen to Mogollon’s music as they celebrate 20 years of performing at the Nevada County Fair. Or, how about visiting Circus Imagination, where children become instant stars by being selected from the audience, put in costume, and then performing in a spontaneous circus for the crowd.

Long-time crowd pleasing events will soar into the Fair’s arena Wednesday through Sunday evening. There’s the Flying U Extreme Rodeo happening on Wednesday and Thursday evening; while Friday and Saturday night features Tuff Trucks and Monster Trucks. On Sunday, the ever-popular Destruction Derby returns to the arena. All arena events begin at 7 pm.

Enjoy ongoing, musical entertainment at one of the outdoor stages. This year features a variety of music – pop rock, country rock, traditional country, Chicago-style blues, jazz, traditional and contemporary bluegrass, rockabilly dance, and rock and roll. Barbershop quartets, hula dancing and dancers, and Nevada County’s Concert Band will also be featured on the various stages.

For more fun, enter one of the special contests held daily in the Special Events tent. There’s a Cell Phone Photo Scavenger Hunt, an Instagram contest, Field Games, Kids Duct Tape Art Challenge, a Yo-Yo Contest, a Scrapbook Page Layout Contest, “Minute to Win It” fun, a Diaper Derby, a Just Dance Contest, and nightly karaoke. No pre-registration required – just show up and have fun. Details for contests are available on the Fair’s website.

A visit to the Fair wouldn’t be complete without a visit to Treat Street. It is here that you’ll find an array of delicious foods and drinks – pasties, tacos, corn on the cob, beer, tempura zucchini, baked potatoes, nachos, hamburgers, corn dogs, caramel corn, and more – all while supporting local, non-profit organizations.

For best deals, purchase your tickets before the Fair begins. Tickets are on sale now and advanced sale discounts are available through August 5 at 5 pm. To purchase tickets, visit NevadaCountyFair.com, stop by the Fair Office, or call the Fair Office.

Join us at this year’s Nevada County Fair, August 6 – 10, and find out why we’ve been voted as the “Best Community Event” for 12 years in a row. The Nevada County Fairgrounds is located at 11228 McCourtney Road in Grass Valley. For a list of daily activities, event details, tickets, or general information, visit www.NevadaCountyFair.com or call (530) 273-6217.

Note: this blog was originally posted with incorrect fair dates. This has been corrected.

Live in Nevada County? Call or email today
for a your free home market anaylsis

John J. O’Dell Realtor® GRI
O’Dell Realty
(530) 263-1091
Email John

BRE#00669941

Nevada County Fairgrounds Foundation to Host Cioppino Feed

nevada-county-fairgrounds-l


Join the Nevada County Fairgrounds Foundation at its fourth annual All-You-Can-Eat Cioppino Feed on Saturday, March 7 at Ponderosa Hall at the Nevada County Fairgrounds. Doors open at 5 pm, and dinner service begins at 6 pm.

For the event, the chefs will create and serve Arnie Romanello’s special 100-year-old recipe for all to enjoy. Dinner includes antipasto, all-you-can-eat Cioppino, salad and garlic bread.  This year, a pasta dish will be available to those who do not prefer Cioppino, but want to attend the event. A no-host bar will also be available, and there will be a silent dessert auction and a live auction.

Tickets are $40 per person. If you’d like to purchase a table for 8, it is $350 and includes two bottles of wine.

Tickets are available by visiting the Nevada County Fairgrounds, calling the Fair Office at (530) 273-6217, or downloading an order form at www.NevadaCountyFair.com/foundation.

Proceeds from the event will benefit the Nevada County Fairgrounds Foundation and its mission of supporting and improving the community’s Fairgrounds.

For more information, visit www.NevadaCountyFair.com or call the (530) 273-6217.

Live in Nevada County? Call or email today
for a your free home market anaylsis

John J. O’Dell Realtor® GRI
O’Dell Realty
(530) 263-1091
Email John

BRE#00669941

The Best Seasons to Sell a Home

Photo courtesy of http://www.dailymail.co.uk/


Spring is traditionally considered the best season to list a home, but it doesn’t inch out the other seasons by much, according to a new analysis by the real estate brokerage Redfin.

Check out our last report from Redfin’s seasonality study

Redfin’s research team analyzed 7 million homes listed from 2010 through 2014 to gauge how important the season is in listing a home. It examined how many of the homes went under contract within 30 days and how often they sold for more than their list price.

Here’s how the seasons stacked up:

  • 39% of the homes listed in the spring (between March 21 and June 20) in the past five years went under contract within 30 days, and 15 percent sold for more than the list price.
  • 38% of homes listed in the winter (Dec. 21 – March 20) sold within 30 days and 14 percent sold for more than the list price.
  • 36% of homes listed in the summer (June 21 – Sept. 20) were under contract within 30 days and 12 percent sold above the list price.
  • 34% of homes listed in the fall (Sept. 21 – Dec. 20) went under contract within 30 days and 11 percent sold at a premium.

“Just as buyer demand follows a seasonal pattern, so do home prices,” says Nela Richardson, Redfin’s chief economist. “Over the past five years prices have increased by an average of 3 percent month over month in the spring and ticked down by about 1 percent each month during the fall. To get the best of both worlds, sellers need be informed on both local buyer demand and recent sale prices in their neighborhoods before deciding when to list their homes and for what price.”
Live in Nevada County? Call or email today
for a your free home market anaylsis

John J. O’Dell Realtor® GRI
O’Dell Realty
(530) 263-1091
Email John

BRE#00669941

87% of Homes Qualify for Down Payment Aid

Photo courtesy of http://funny-pics-fun.com/funny-compilations/home-sweet-home

More prospective home buyers would likely qualify for down payment assistance than they think. Indeed, more than 68 million single-family and condo households – or about 87 percent — would qualify for a down payment program available in the county where they are located, according to a new study by Down Payment Resource and RealtyTrac in an analysis that included a look at nearly 2,300 down payment programs nationwide.

“Many homebuyers, especially Millennials, haven’t fully investigated their home financing options because they are pessimistic about qualifying for a mortgage,” says Rob Chrane, president and CEO of Down Payment Resource. “Our Homeownership Program Index highlights the wide range and availability of down payment programs available to today’s homebuyers. In fact, 91 percent of the 2,290 programs in our registry have funds available to lend to eligible buyers. Plus, income limits vary depending on the market and programs extend beyond just first-time homebuyers. It’s important for buyers to research down payment programs as part of their loan shopping process.”

Read the rest of the story here

Need help in buying your home?
Call or email me today

John J. O’Dell Realtor® GRI
O’Dell Realty
(530) 263-1091
Email John

BRE#00669941

Oil Prices Dropping, Good News or Bad News For Home Buyers

Photo courtesy of http://worldsamazinginformation.blogspot.com/2011/06/worlds-top-10-biggest-oil-producer.html


The drastic drop in oil prices could put downward pressure on mortgage rates.

The U.S. Energy Information Administration reported that the price of regular gasoline was $2.20 per gallon, its lowest point since a peak of $4 per gallon in May 2011. EIA estimates that the savings could amount to $550 per household in 2015.

It might not all be good news:Lower Oil Prices Could Stall Home Appreciation

“Lower oil prices mean a lower inflation rate, which pushes down mortgage rates,” economists note at the National Association of REALTORS®‘ Economists’ Outlook blog. Indeed, the 30-year fixed-rate mortgage averaged 3.73 percent last week — the lowest average in 20 months — according to Freddie Mac’s weekly mortgage market survey. Taking into account the median home price of $205,300, a 0.75 percentage point drop in mortgage rates could yield a savings of about $1,000 annually, according to NAR researchers.

“What this means for REALTORS®: The decline in oil prices is generally positive to households by way of the gas savings and lower mortgage payments,” economists note. “That savings will boost consumer spending in other areas. But there may be some layoffs in oil-producing states.”

The lower oil prices may prompt revenues to flatten out in some oil-boom areas, notably North Dakota and Texas.

Still, the overall impact to national employment likely will be minimal, since most of the employment growth is coming from many economic sectors. Those employed in oil and gas extraction represent just 0.14 percent of the U.S.’s 138 million workers, according to data from the Bureau of Labor Statistics. Most state economies are diversified enough, too. Even in Texas, which is the biggest state for oil production and accounts for about half of U.S. oil and gas extraction workers, the oil industry covers less than 1 percent of its workers.

That said, some smaller counties may feel the impact more, since they do have higher employment in the oil sector. Those counties include Washington County, Okla.; Upton County, Texas; Woods County, Okla.; Crockett County, Texas; Hutchinson County, Texas; Yoakum County, Texas; and Gilmer County, W. Va.

Source: “Recent Oil Trends and What They Mean for the Housing Recovery,” National Association of REALTORS® Economists’ Outlook Blog (Jan. 12, 2015)


Live in Nevada County? Call or fill out the form below
for a your free home market analysis’

John J. O’Dell Realtor® GRI
O’Dell Realty
(530) 263-1091

BRE#00669941

Error: Contact form not found.